

Financial markets are driven by an intricate web of economic data, central bank policies, and corporate earnings. However, underlying every price tick, order execution, and breakout is a fundamentally human element: market sentiment.
At its core, market sentiment represents the collective attitude, expectations, and emotional tone of market participants toward a financial market, asset class, or broader economic outlook. Whether trading currencies, equities, commodities, or digital assets, sentiment acts as the psychological backdrop against which all technical and fundamental information is processed.
When optimism dominates, buying pressure can drive prices upward sometimes beyond what fundamental metrics might justify. Conversely, when pessimism or uncertainty takes hold, defensive selling and risk aversion can send asset prices tumbling. Yet, it is vital to understand that sentiment is not identical to price direction. Highly bullish expectations may already be fully priced into a market, leaving it vulnerable to a sharp sell-off on even mildly disappointing news. Similarly, overwhelming negative sentiment does not guarantee further declines if market participants have already liquidated their positions.
In this comprehensive guide, we will break down the mechanics of market sentiment. We will explore how fear and greed influence trading behavior, decode the dynamics of risk-on and risk-off environments, evaluate the primary indicators used to measure market sentiment, and provide a practical, six-step framework for integrating sentiment into your trading approach.
What Is Market Sentiment in Trading?
To navigate financial markets effectively, traders must distinguish between what the market is feeling and what the market is doing. Market sentiment provides crucial context for price action, helping traders understand the underlying conviction behind a market move.
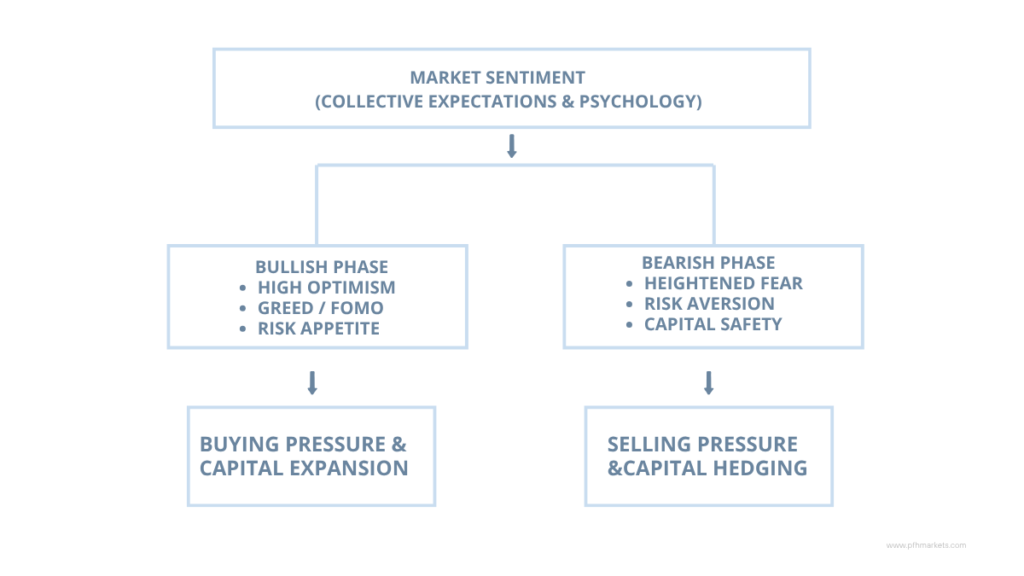
Market Sentiment Explained in Simple Terms
In simple terms, market sentiment is the general consensus or mood of investors and traders. If the majority of participants expect prices to rise, sentiment is described as bullish. If participants expect prices to fall, sentiment is described as bearish.
This collective mood is formed by a complex mix of news headlines, macroeconomic releases, geopolitical events, quarterly earnings, and recent price action. While individual participants may hold vastly different views, market sentiment reflects the prevailing crowd psychology that drives net capital flows at any given moment.
The Difference Between Market Sentiment and Market Trends
It is common for novice traders to confuse market sentiment with a market trend, but they measure distinct aspects of the market:
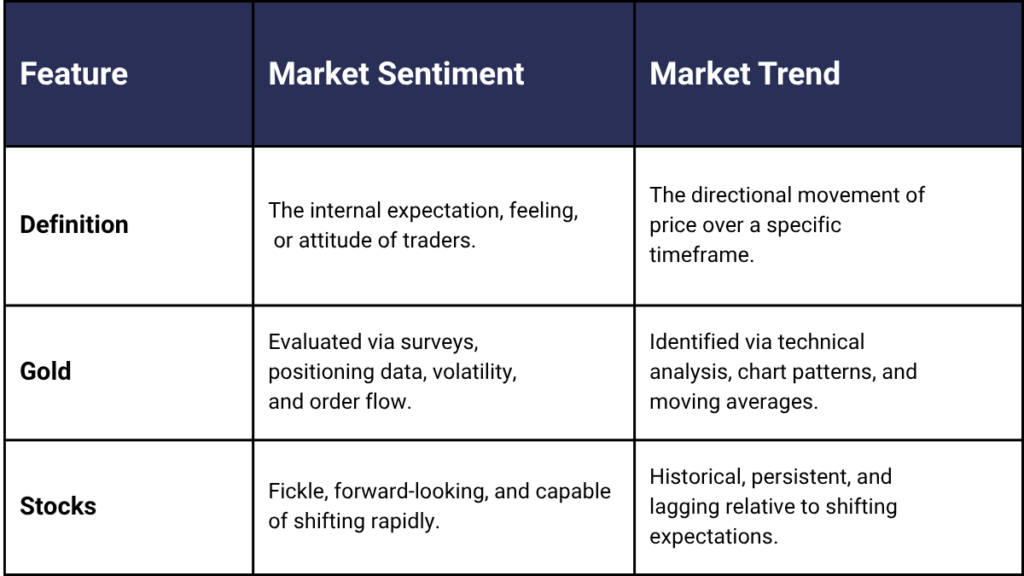
Example: Consider a scenario where a global central bank is expected to cut interest rates. Market sentiment for equities may become highly optimistic in anticipation of lower borrowing costs, driving speculative buying days or weeks before the policy decision occurs. If the central bank eventually cuts rates exactly as expected, the stock market might actually fall in a “sell the news” event because the bullish sentiment was already fully reflected in current prices.
How Investor Sentiment Influences Buying and Selling Decisions
Investor sentiment directly affects order flow. When optimism takes over, market participants become more comfortable taking on risk, leading to an influx of buy orders, increased leverage, and a willingness to purchase assets at higher valuations.
Conversely, when sentiment deteriorates, investors prioritize capital preservation. Institutional managers may rebalance portfolios away from growth equities and high-yielding currencies toward lower-yielding, perceived safe-haven assets. This shift in investor behavior alters the balance of supply and demand, creating sustained selling pressure or sudden volatility spikes.
Why Sentiment Can Change Faster Than Economic Fundamentals
Economic fundamentals such as GDP growth, corporate earnings, labor market trends, and inflation rates typically evolve over months or quarters. Market sentiment, however, can change in seconds. A single unexpected headline, a sudden central bank statement, or an escalation in geopolitical tension can immediately transform a bullish market into a risk-averse environment long before any physical change occurs in economic data.
Because sentiment is forward-looking and inherently psychological, it responds to the perception of future risk rather than current economic conditions.
Fear and Greed in Financial Markets
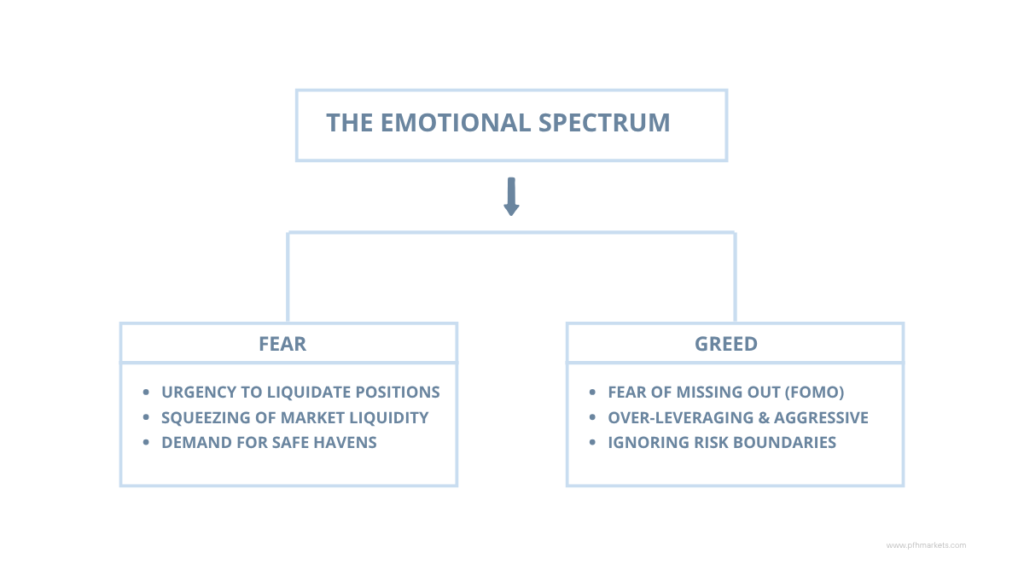
Financial markets are driven by two foundational human emotions: fear and greed. Understanding how these psychological forces operate across retail and institutional trading is central to mastering market psychology.
How Fear Influences Trading Decisions
Fear manifests when market participants perceive unexpected danger, capital loss, or heightened uncertainty. When fear dominant the market, traders instinctively move to protect their capital. Common behavioral signs of fear include:
- Aggressive liquidation: Unwinding long positions to lock in remaining profits or cut losses.
- Flight to safety: Capital allocation shifts out of volatile growth assets and into cash, sovereign debt, or precious metals.
- Surging demand for hedging: Institutional traders purchase protective put options, driving up volatility indexes.
Fear tends to move markets much faster than greed. Because capital preservation is a biological imperative, selling cascades driven by panic can cause sharp, swift downward price spikes.
How Greed Can Encourage Excessive Risk-Taking
Greed emerges during prolonged uptrends or speculative market expansions. As prices consistently climb, traders experience the fear of missing out (FOMO). Greed incentivizes several dangerous trading behaviors:
- Chasing extended moves: Entering long positions after significant upward moves, long after favorable risk-reward ratios have evaporated.
- Excessive leverage: Increasing position sizes beyond disciplined risk parameters to maximize short-term gains.
- Ignoring risk management: Dismissing stop-loss discipline and fundamental warning signs under the belief that the market will continue rising indefinitely.
Why Fear and Greed Can Amplify Price Movements
When either fear or greed spreads across a critical mass of market participants, a self-reinforcing feedback loop forms. In a greed-driven market, rising prices attract more speculative buyers, which drives prices higher, attracting further attention until market valuation becomes stretched.
In a fear-driven market, falling prices trigger stop-loss orders and margin calls. This forced liquidation increases selling volume, driving prices down further and triggering additional panic. This dynamic explains why asset prices often overshoot reasonable valuation metrics at both market tops and market bottoms.
How Experienced Traders Recognize Emotional Decision-Making
Professional traders monitor market indicators to identify when emotional extreme levels are reached. Instead of joining the emotional crowd, disciplined traders view extreme fear or greed as a signal to exercise caution:
- At extreme greed: They tighten stop-loss levels, reduce position sizing, or scale out of positions, recognizing that a crowded trade leaves little buying power remaining to support further upside.
- At extreme fear: They evaluate whether panic selling has created asymmetric buying opportunities where asset prices have decoupled from long-term fundamental value.
What Do Risk-On and Risk-Off Markets Mean?
In global finance, market sentiment is often categorized through the framework of risk appetite. Markets continually rotate between two macro environments: risk-on and risk-off.
Understanding Risk-On Market Conditions
A risk-on environment occurs when macroeconomic sentiment is optimistic, financial conditions are accommodative, or systemic uncertainty is low. In this environment, investors actively seek higher yields and capital appreciation, showing a willingness to accept higher volatility in exchange for potential returns.
Key characteristics of risk-on conditions:
- Rising equity markets and high-yield corporate debt.
- Appreciation in growth-linked and commodity-sensitive currencies.
- Increased capital flows into emerging markets and high-beta assets.
- Declining demand for defensive instruments.
Understanding Risk-Off Market Conditions
A risk-off environment occurs when geopolitical tensions escalate, macroeconomic data deteriorates, or central bank policies unexpectedly tighten. Under these conditions, global market participants prioritize capital preservation over return on capital.
Key characteristics of risk-off conditions:
- Broader declines across global stock indices and corporate bonds.
- Capital flows migrating toward perceived safe-haven assets.
- Increased implied volatility and option hedging activity.
- Unwinding of speculative carry trades.
When evaluating broader geopolitical events and market risk, understanding how macroeconomic shocks filter into safe-haven flows is essential for maintaining portfolio stability.
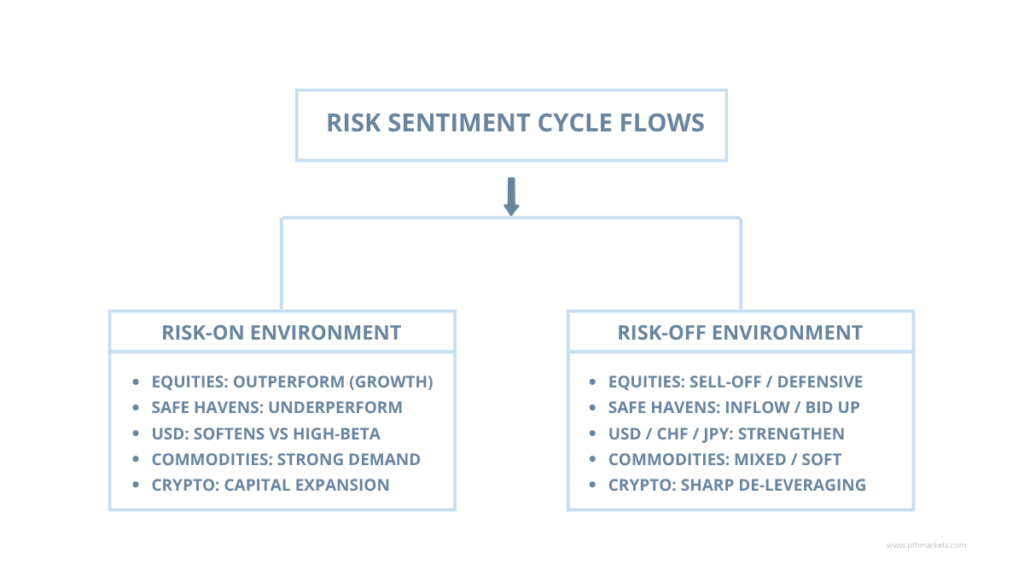
Asset Class Behavior Across Risk Sentiment Cycles
To understand how global capital reallocates between risk-on and risk-off cycles, consider how primary asset classes typically respond:
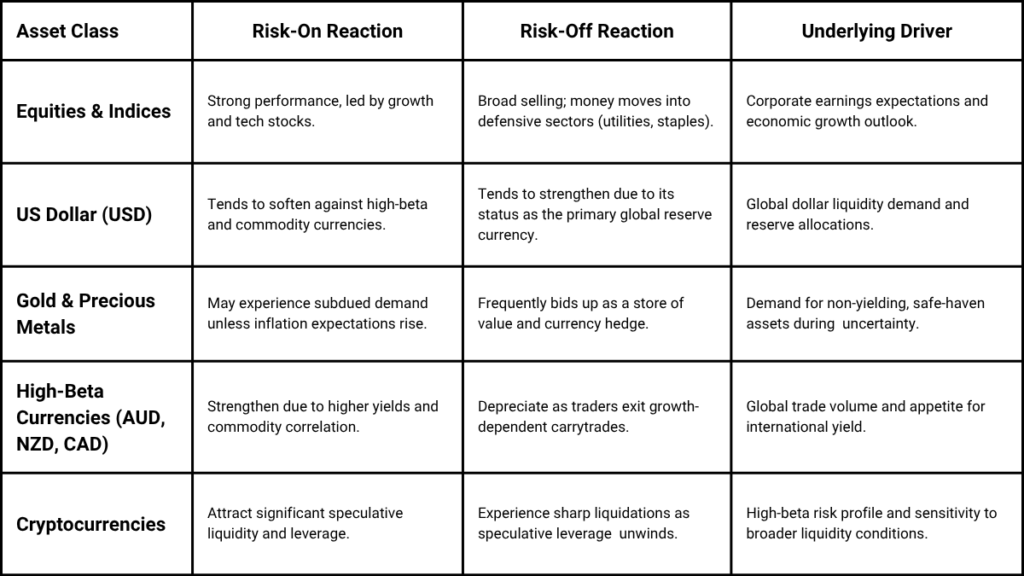
Why Risk-On and Risk-Off Signals Can Conflict
While the risk-on/risk-off framework provides a helpful baseline, financial markets rarely operate in absolute binaries. Signals across asset classes frequently conflict due to competing macroeconomic dynamics:
- Divergent Monetary Policies: A country raising interest rates to combat inflation may see its currency appreciate during a risk-off phase, overriding traditional risk-off capital flows.
- Supply-Side Commodity Shocks: Geopolitical tensions in major oil-producing regions can drive energy prices higher even while global equity markets sell off due to growth concerns. This creates a stagflationary environment where traditional risk-off assets perform unpredictably.
How Traders Measure Market Sentiment
Because sentiment represents psychological state rather than a single metric, traders rely on a combination of direct indicators (which measure trader expectations) and indirect indicators (which infer sentiment from price behavior and positioning).
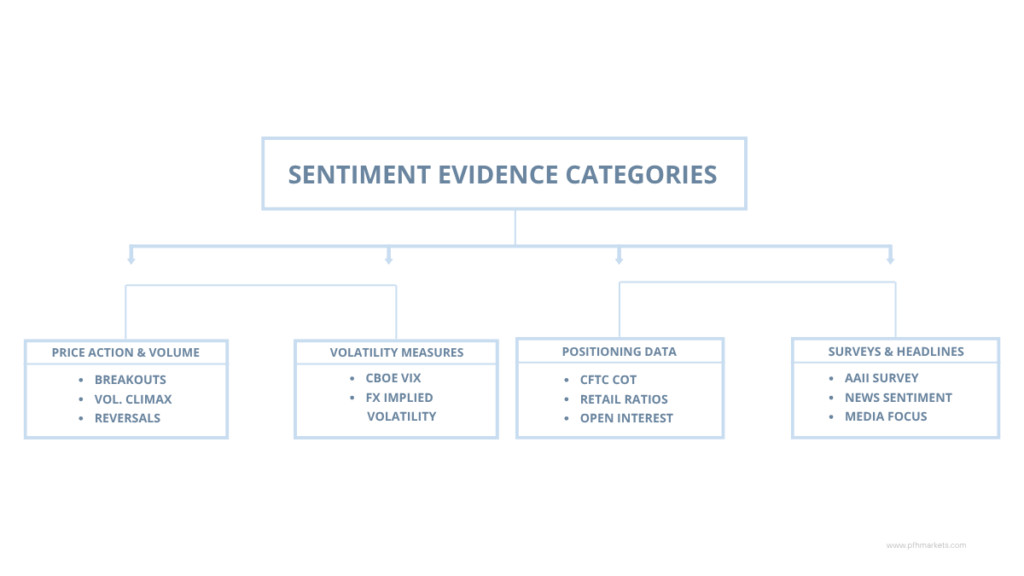
Price Action and Trading Volume
Price action remains the ultimate gauge of market sentiment. How a market responds to news often reveals more about underlying sentiment than the news itself.
- Bullish Sentiment Signature: The market absorbs bad news without falling significantly and rallies aggressively on good news.
- Bearish Sentiment Signature: The market struggles to rally on positive economic data and breaks key support levels quickly on negative news.
Trading volume adds important context. High volume during a price breakout indicates strong institutional participation and high conviction. Conversely, low-volume price advances suggest a lack of aggressive buying interest, leaving the market vulnerable to reversals.
Volatility Measures and Market Uncertainty
Volatility indices measure the market’s expectation of future price fluctuations, serving as a direct gauge of investor anxiety:
- The Cboe Volatility Index (VIX): Often referred to as the “fear gauge,” the VIX measures the 30-day implied volatility of S&P 500 options. Elevated VIX levels (typically above 25–30) reflect high uncertainty and institutional demand for downside portfolio protection. Low readings (below 12–15) suggest complacency or calm market conditions.
- FX Implied Volatility: In forex markets, implied volatility derived from currency options highlights upcoming event risk and anticipated exchange rate swings.
Positioning Data and Speculative Exposure
Positioning metrics reveal how market participants are allocated, helping traders identify crowded trades:
- Commitment of Traders (CoT) Report: Published weekly by the U.S. Commodity Futures Trading Commission (CFTC), the CoT report breaks down open interest in futures markets across Commercial Hedgers, Large Speculators (hedge funds), and Small Speculators. When Large Speculation net-long or net-short exposure reaches historical extremes, it often signals an overextended trade near a market turning point.
- Retail Sentiment Ratios: Brokerages frequently publish long/short ratios showing the positioning of retail traders. Because retail traders often trade against prevailing institutional trends, extreme retail positioning is frequently used as a contrarian indicator.
Surveys, Sentiment Indexes, and Confidence Indicators
Direct survey data captures qualitative investor attitudes across different market segments:
- AAII Sentiment Survey: Measures the percentage of individual investors who are bullish, bearish, or neutral on the stock market over a six-month horizon.
- CNN Fear & Greed Index: Aggregates seven distinct market factors including stock price momentum, put/call ratios, junk bond demand, and safe-haven demand into a single metric ranging from 0 (Extreme Fear) to 100 (Extreme Greed).
News Coverage and Changes in Market Expectations
Media coverage often mirrors current crowd sentiment. When financial headlines become universally bullish or bearish, it usually indicates that the prevailing sentiment has reached maximum market saturation. Professional traders systematically track media tone shifts and changes in forward expectations, such as interest rate expectations derived from futures pricing.
How Market Sentiment Affects Different Financial Markets
While broad macroeconomic sentiment influences all asset classes, each individual market processes sentiment signals differently depending on its unique market structure and participant mix.
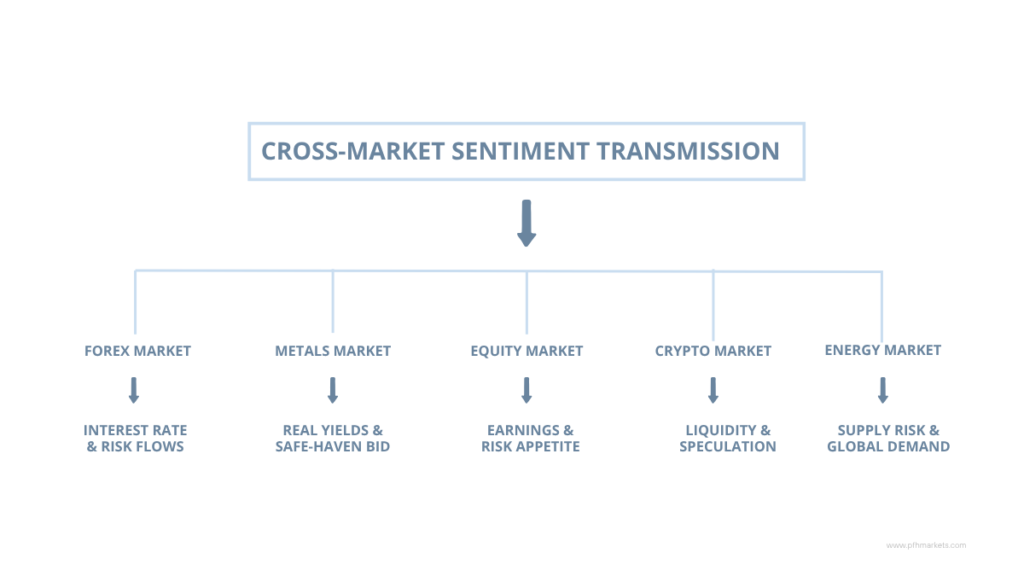
Forex: Currency Demand, Yields, and Risk Appetite
In the global forex markets, currency pairs are constantly weighed against each other based on interest rate differentials and risk sentiment. During risk-on phases, capital flows out of lower-yielding reserve currencies (such as the JPY or CHF) toward growth-oriented, commodity-linked currencies (such as AUD, NZD, and CAD). In contrast, during periods of systemic shock, safe-haven demand tends to bid up the US Dollar, Japanese Yen, and Swiss Franc regardless of local economic data.
Gold and Metals: Safe-Haven Demand and Real Yields
In precious metals markets, sentiment is tied closely to real interest rates (nominal yield minus inflation) and systemic uncertainty. Gold acts as a primary hedge against currency debasement and geopolitical turmoil. During risk-off environment escalations, capital flows into gold even if nominal interest rates are elevated, reflecting institutional demand for assets without counterparty risk.
Stocks and Indices: Earnings and Risk Tolerance
In global stock indices and individual equity markets, sentiment is closely tied to corporate profitability expectations, consumer demand, and broader monetary liquidity. In high-sentiment, risk-on regimes, equity valuations can expand even during periods of modest earnings growth. However, when market sentiment turns risk-averse, deteriorating investor confidence often compresses valuation multiples, leading to broad market drawdowns.
Crypto Markets: Speculative Positioning and Liquidity
The cryptocurrency markets represent one of the most sentiment-sensitive asset classes. Lacking traditional cash-flow valuation models, digital assets are driven primarily by macro liquidity conditions, leverage, and retail/institutional sentiment. Shifts in risk appetite can cause rapid, outsized price swings across major cryptocurrencies and altcoins alike.
Energy Markets: Supply Expectations and Industrial Growth
In global energy markets, sentiment is driven by a balance of industrial growth expectations and supply-chain vulnerability. Optimistic economic sentiment implies higher global oil and gas consumption, supporting energy prices. However, geopolitical supply threats can trigger severe price spikes even during periods of weak underlying economic growth.
How Market Sentiment and Volatility Are Connected
Understanding the structural relationship between market sentiment and volatility is crucial for managing risk and avoiding common trading pitfalls.
Why Uncertainty Increases Price Fluctuations
Volatility measures how rapidly and severely asset prices move over a given period. When economic or geopolitical uncertainty enters the market, market participants struggle to accurately price future fundamentals.
As a result, bid-ask spreads widen, market liquidity thins, and institutional desks adjust portfolio hedges rapidly. This decline in order book depth means that standard order sizes cause larger price movements, creating elevated volatility.
When Extreme Sentiment Coincides with Market Reversals
Some of the most powerful price reversals occur when sentiment reaches extreme levels. When sentiment becomes overwhelmingly bullish, almost everyone who wants to buy has already bought, exhausting marginal buying power. At this point, the trade becomes “crowded.”
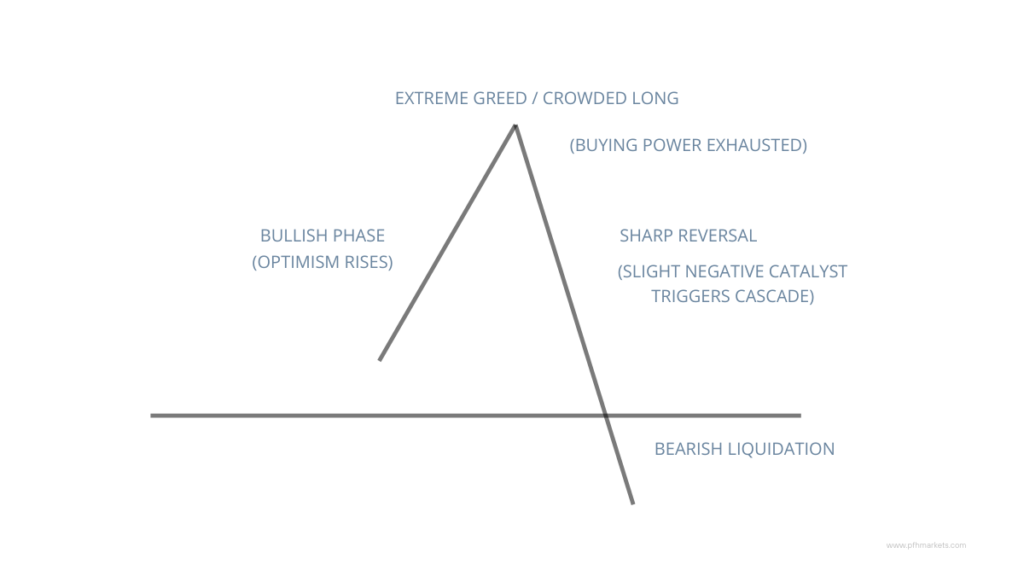
If a slight negative catalyst occurs, those crowded long positions rush for the exit simultaneously. Because few buyers remain on the sidelines to absorb the selling pressure, the market experiences a sharp, sudden price reversal. The inverse process occurs at sentiment-driven market bottoms, where extreme fear triggers short-covering rallies.
Why Low Volatility Does Not Always Mean Low Risk
Extended periods of unusually low volatility often induce market complacency. During these phases, traders frequently increase leverage and take on larger position sizes to maintain yield.
However, low volatility reflects past stability, not future safety. Protracted calm can build systemic risk, as crowded positions and high leverage leave the market fragile to sudden, unpriced news events.
How Traders Distinguish a Shift in Sentiment from Market Noise
Intraday price fluctuations and short-term headline noise frequently trigger temporary sentiment swings that do not alter the broader market direction. To distinguish genuine sentiment shifts from short-term noise, experienced traders look for structural confirmation:
- Cross-Asset Alignment: A true risk-off shift will show simultaneous moves across multiple markets—such as equities falling alongside rising bond prices, a surging VIX, and a strengthening US Dollar.
- Sustained Price Follow-Through: Genuine sentiment shifts hold price breaks below key support or above key resistance levels across multiple sessions, rather than reversing within a single candle.
- Institutional Volume Confirmation: Sustained sentiment shifts are accompanied by high volume in futures and cash markets, confirming institutional portfolio rebalancing.
For a deeper analysis of how changing uncertainty and volatility impact market structure, review our guide on understanding forex volatility.
A Practical Framework for Reading Market Sentiment
To avoid reacting impulsively to headline news, traders need a structured approach to analyze market sentiment before making trading decisions. Here is a six-step framework you can integrate into your analysis:
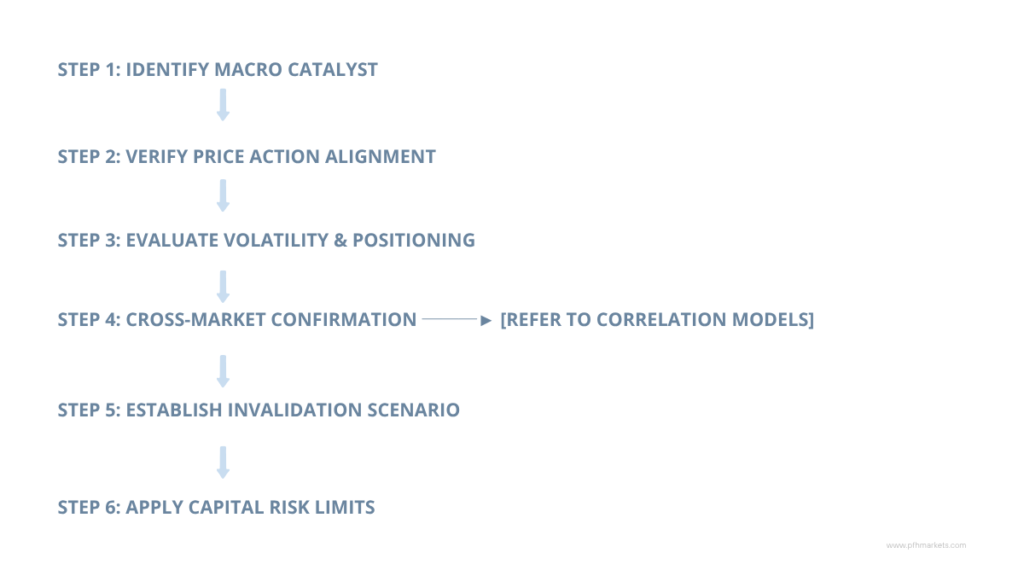
Step 1: Identify the Event or Factor Driving Current Expectations
Determine what macro variable is driving market attention. Is the market focused on central bank policy decisions, inflation data, corporate earnings season, or geopolitical developments? Identifying the core narrative clarifies what news matters most to market participants.
Step 2: Check Whether Price Action Supports the Prevailing Sentiment
Compare the fundamental news narrative against actual price behavior. Is the asset breaking key technical levels in the direction suggested by the headlines? If economic data is exceptionally positive but the asset fails to rally, the market may be signaling that the good news is already priced in.
Step 3: Review Volatility, Volume, and Positioning Evidence
Look beyond the price chart to check supporting sentiment indicators:
- Is the VIX or relevant FX volatility metric rising or falling?
- Are futures positioning reports (CoT) at historic extremes?
- Does trading volume confirm that institutional capital is driving the move?
Step 4: Compare Related Markets for Confirmation or Disagreement
Check correlated asset classes to verify if the sentiment move is isolated or market-wide. For example, if equity markets are rallying on perceived risk-on sentiment, check whether high-beta currencies are also appreciating and safe-haven bonds are softening.
Evaluating established relationships between currencies and gold
provides valuable confirmation when assessing whether a safe-haven bid is genuine across asset classes.
Step 5: Define the Scenario That Would Invalidate the View
Before entering a position, explicitly outline what price action or fundamental development would prove your sentiment thesis wrong. If you are taking a risk-off trade based on escalating tensions, define the specific price level or headline event (such as a diplomatic resolution) that would signal sentiment has shifted back to neutral.
Step 6: Set Risk Limits Before Making a Trading Decision
Sentiment analysis provides valuable market context, but it is not an exact timing tool or guaranteed forecast. Translate your analysis into a structured trading plan with clearly defined entry points, stop-loss orders, position sizing aligned with current volatility, and realistic profit targets.
Hypothetical Practical Scenario: Interpreting a Risk-Off Shift
To understand how this six-step framework applies in real-world trading, let us walk through a hypothetical market scenario:
Market Setup: Mid-week economic reporting shows unexpected inflation spikes across major economies, raising concerns that central banks will maintain higher interest rates for longer.
- Identify Catalyst: Rising interest rate expectations and growing concerns over slowing corporate growth.
- Check Price Action: Major stock indices break below key 50-day moving averages on heavy volume.
- Review Volatility & Positioning: The VIX spikes from 16 to 24. CoT data shows institutional funds cutting net-long index futures.
- Cross-Market Confirmation: Gold strengthens alongside the US Dollar, while commodity currencies (AUD, NZD) face steady selling pressure across foreign exchange markets.
- Invalidation Level: A sustained daily close back above major index resistance, accompanied by a decline in volatility back below 18.
- Risk Execution: A trader reduces overall equity risk exposure, avoids initiating new high-beta long positions, and sets strict, volatility-adjusted stop-loss levels on existing trades.
Common Mistakes When Interpreting Trading Sentiment
Even experienced market participants can misinterpret sentiment signals. Avoiding these common analytical errors will keep your trading strategy grounded:
- Assuming Sentiment Predicts Exact Timing: Sentiment tells you how the market is positioned and feeling, but it rarely pinpoint exact market tops or bottoms. Extreme sentiment can persist much longer than expected.
- Treating Popular Opinion as Proof of Direction: Following consensus media narratives often leads to entering trades at market tops or liquidating at market bottoms, right when the crowd has reached maximum saturation.
- Ignoring Crowded Trades and Liquidations: Failing to check positioning data leaves traders vulnerable to sharp squeezes when crowded long or short trades unwind unexpectedly.
- Confusing High Volatility with Bearish Sentiment: High volatility simply reflects expanded price ranges and heightened uncertainty; it can occur during aggressive upward squeezes as well as market sell-offs.
- Relying on a Single Sentiment Indicator: Basing trading views solely on one metric—such as the put/call ratio or a single retail survey—without confirming cross-market price action increases false signals.
- Altering Trading Plans on Every Headline: Constantly switching your market bias in response to every breaking news headline leads to over-trading, high transaction costs, and emotional fatigue.
FAQ
How can traders identify bullish or bearish sentiment?
Traders identify sentiment by evaluating a combination of price action, trading volume, positioning data (such as the CFTC CoT report), volatility metrics (like the VIX), retail long/short ratios, and broader financial news trends.
What is the difference between risk-on and risk-off?
Risk-on describes an environment where investors feel confident and aggressively seek higher returns in growth-oriented assets like equities, commodities, and high-beta currencies. Risk-off describes an environment where uncertainty prompts investors to protect capital by moving into cash, sovereign bonds, the US Dollar, and gold.
Which indicators help measure market sentiment?
Key sentiment indicators include the Cboe Volatility Index (VIX), the Commitment of Traders (CoT) report, retail trader positioning ratios, option put/call ratios, survey metrics like the AAII Index, and the CNN Fear & Greed Index.
Can market sentiment predict price movements?
Market sentiment does not guarantee future price movements. Instead, it provides valuable market context. Sentiment is most useful when identifying extreme positioning, potential market exhaustion, or divergences where price fails to confirm prevailing market news.
How do fear and greed influence financial markets?
Fear accelerates selling pressure as traders rush to preserve capital, often causing fast downward price movements and spikes in volatility. Greed encourages speculative buying and leverage, driving prolonged uptrends that can push market valuations beyond fundamental norms.
How often should traders reassess market sentiment?
Traders should reassess sentiment continually based on their operational timeframe. Swing and position traders typically review weekly macro calendars, positioning reports, and cross-market developments, while day traders track shift in order flow, intraday news catalysts, and volatility spikes.
Key Takeaways
Market sentiment represents the collective psychological state of market participants, serving as the link between fundamental developments and price behavior. Understanding sentiment helps traders understand why the market reacts the way it does to headlines and economic data.
- Sentiment is not price: Bullish feelings can exist in an already fully priced market, meaning sentiment must always be validated by price action.
- Fear acts faster than greed: Panic liquidation drives fast downward spikes and volatility jumps, whereas greed leads to longer, more gradual speculative expansions.
- Macro sentiment shifts through risk cycles: Capital flows dynamically between high-yielding risk assets during risk-on phases and defensive, safe-haven instruments during risk-off regimes.
- Avoid single-indicator reliance: Evaluate sentiment by cross-referencing price behavior, volume, option volatility, futures positioning reports, and cross-asset correlations.
- Use sentiment as context, not a standalone forecast: Incorporate sentiment into a disciplined trading plan alongside defined entry criteria, clear invalidation levels, and strict risk management.
Disclaimer: This material is provided for informational and educational purposes only and does not constitute financial, investment, or trading advice. Trading foreign exchange, commodities, equities, and digital assets carries a high level of risk to your capital and may not be suitable for all investors.