

Financial markets do not move in total isolation. A shift in central bank interest-rate expectations, a sudden change in crude oil supply, a surge in global inflation, or a sudden swing in investor confidence can ripple across multiple asset classes simultaneously.
Cross-Asset Trading is the practice of evaluating and trading across these interconnected markets specifically forex, commodities, cryptocurrencies, and equity indices. By analyzing these multi-market relationships, traders gain broader context on global capital flows, identify emerging risks, and avoid evaluating individual assets in a vacuum.
However, it is essential to set realistic expectations from the outset: market relationships are dynamic, subject to constant evolution, and a strong historical correlation between two assets does not imply that one causes the other to move.
What Is Cross-Asset Trading?
Before diving into advanced intermarket strategies, it is helpful to establish foundational terminology and understand the primary scope of cross-asset analysis.
To learn more about individual foreign exchange categories, read our guide on major, minor & exotic currency pairs.
Understanding Cross-Asset Trading and Cross-Market Trading
- Cross-Asset Trading: Refers to analyzing, allocating, or trading across different financial asset classes (e.g., holding or analyzing positions in both currencies and equities).
- Cross-Market Trading: Focuses specifically on evaluating the price action and structural relationships between two or more distinct markets.
- Intermarket Analysis: The overarching methodology of studying how different sectors and asset classes react to shared macroeconomic and financial drivers.
Which Asset Classes Are Involved?
- Forex (Foreign Exchange): Global national currencies and exchange rates driven by trade balances and interest-rate differentials.
- Commodities: Raw physical goods such as gold, crude oil, copper, and agricultural products.
- Cryptocurrencies: Digital assets such as Bitcoin and Ethereum that combine market liquidity with tech-sector dynamics.
- Indices: Baskets of stocks representing specific equity market segments or overall national economic health (e.g., the S&P 500 or FTSE 100).
Cross-Asset Analysis vs. Trading a Single Market
Analyzing a single instrument in isolation can obscure larger systemic trends. While evaluating broader market conditions provides vital context and can prevent trading against major macroeconomic tides, it does not guarantee better individual trade outcomes.
How Do Financial Markets Influence Each Other?
Shared global economic conditions form the connective tissue between seemingly unrelated financial markets.
Interest Rates and Central Bank Decisions
Central bank monetary policy acts as the primary driver of global liquidity. When a central bank signals rate hikes, bond yields generally rise, strengthening the domestic currency while increasing borrowing costs for corporations which can put downward pressure on equity valuations. Crucially, expectations leading up to a decision often move markets just as much as the actual announcement.
Inflation and Economic Growth
Surging inflation can weigh on consumer sentiment and spark expectations of tighter monetary policy, impacting currencies and stock indices. Conversely, robust economic growth supports corporate earnings, but if growth occurs too rapidly, fears of inflation and rate hikes may offset equity gains.
Risk Sentiment and Investor Behaviour
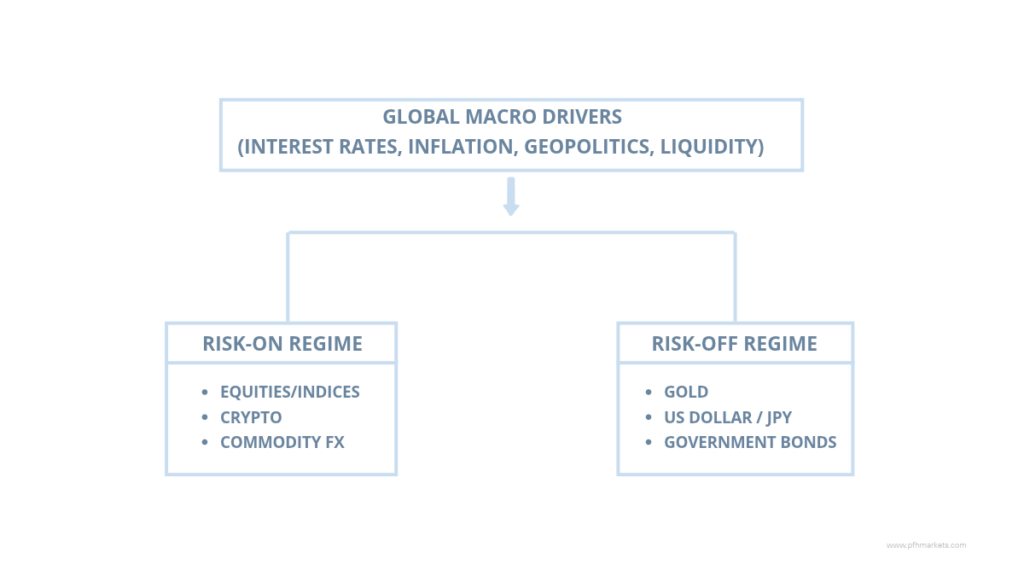
Market environments typically fluctuate between two core regimes:
- Risk-On: High market confidence leads investors toward growth-oriented assets like equities, emerging market currencies, and cryptocurrencies.
- Risk-Off: Heightened uncertainty or market stress drives capital into defensive safe havens like gold, government bonds, or reserve currencies like the US Dollar and Japanese Yen.
Supply, Demand and Geopolitical Events
Geopolitical tensions or supply chain bottlenecks directly affect raw commodities. An unexpected reduction in crude oil supply boosts energy prices, which filters into higher transportation costs, broader consumer inflation, and shifts in currency values for major energy-importing or exporting nations.
Forex and Commodities Understanding Their Relationship
Currency values and physical commodity markets share a deep historical connection due to export dependency and international trade dynamics.
To understand the macroeconomic drivers behind metal markets, see our analysis on key factors influencing gold prices as well as how to analyze currency and gold correlation.
How Oil Prices Can Affect Commodity-Linked Currencies
Nations whose economies rely heavily on raw material exports often see their national currencies react to commodity price movements. For instance, Canada is a major global exporter of crude oil. Consequently, sustained changes in global oil prices can influence Canadian export revenues and demand for the Canadian Dollar (CAD). However, broader factors like domestic interest rates and general US Dollar strength can override this relationship. For a deeper dive into energy market dynamics, explore the main factors that influence Brent crude oil prices.
The Relationship Between Gold and the US Dollar
Gold and the US Dollar historically exhibit a prominent inverse correlation. Because international commodities are primarily priced in USD, a weaker dollar makes gold cheaper for foreign purchasers, supporting gold demand. Additionally, because gold pays no yield, rising real interest rates (which boost the US Dollar) increase the opportunity cost of holding non-yielding gold, often dampening its price.
US Dollar Strength / Real Yields Up ───► Gold Prices Tend to Fall
US Dollar Weakness / Real Yields Down ───► Gold Prices Tend to Rise
Note: In periods of severe global geopolitical stress, both gold and the US Dollar may rally simultaneously as investors seek liquidity and safe-haven reserves.
What Traders Should Watch
- Crude oil supply updates and global demand projections.
- Central bank interest-rate decisions and inflation benchmarks.
- Overall fluctuations in the US Dollar index (DXY).
- Emerging geopolitical risks impacting supply chains.
Crypto and Indices When Do They Move Together?
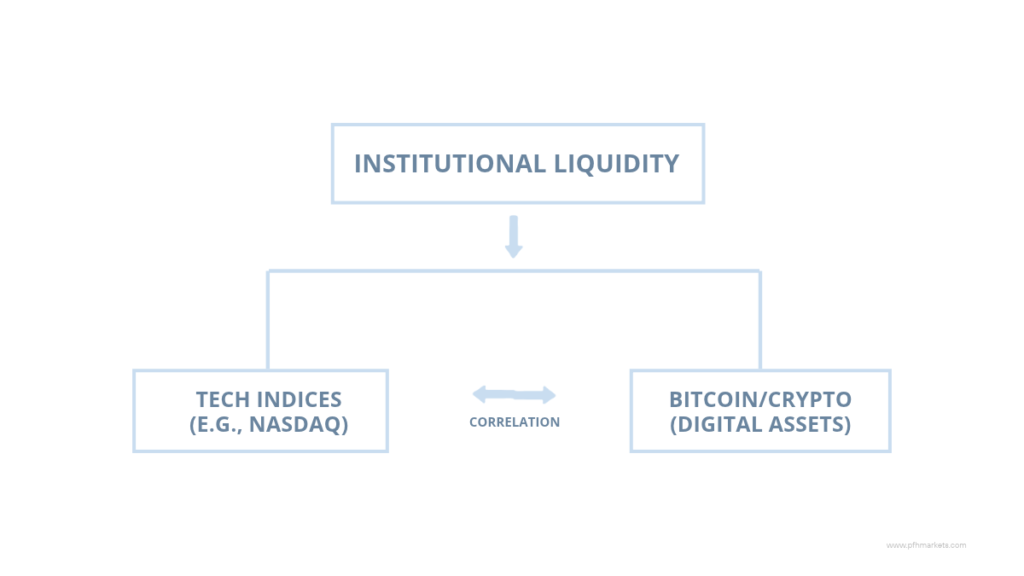
As institutional participation in cryptocurrencies has expanded, the digital asset market has increasingly interacted with traditional financial markets, particularly equity indices.
Learn more about market share dynamics in our guide on Bitcoin dominance and crypto-market relationships.
How Risk Appetite Can Influence Crypto and Equity Markets
During periods of high global market liquidity and low interest rates, investor willingness to acquire risk increases. In these conditions, high-growth technology stocks and cryptocurrencies often display high positive correlation, moving upward together as capital seeks maximum capital appreciation.
Why Bitcoin and Stock Indices Can Diverge
Despite periods of high correlation, Bitcoin frequently diverges from stock indices when crypto-specific dynamics dominate:
- Major regulatory developments or ETF approvals.
- Changes in network protocol rules (e.g., Bitcoin halving events).
- Shifts in digital-asset ecosystem liquidity or crypto exchange flows.
What Bitcoin Dominance Can Tell Traders
Bitcoin Dominance represents Bitcoin’s market capitalization expressed as a percentage of the total cryptocurrency market capitalization. Tracking shifts in Bitcoin dominance helps traders evaluate whether capital is concentrating in Bitcoin or rotating into alternative cryptocurrencies (altcoins), providing valuable internal market structure context.
Understanding Asset Correlation in Cross-Asset Trading
Asset correlation is a fundamental statistical measure used in cross-market analysis to evaluate how two assets move in relation to one another.
For practical examples of statistical tracking, read our educational article on understanding currency and gold correlation.
What Is Positive, Negative and Low Correlation?
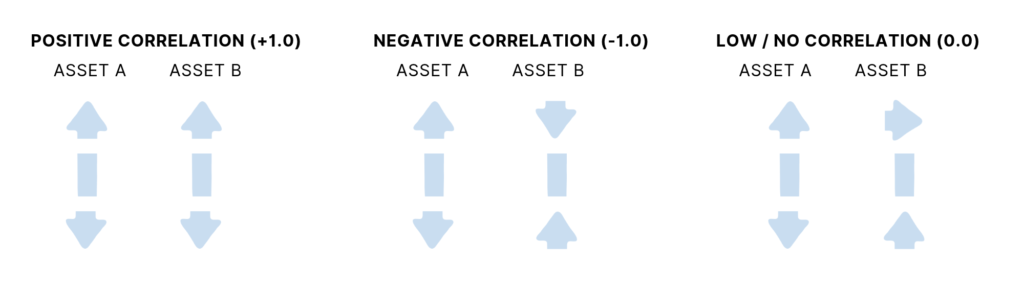
- Positive Correlation: Two assets consistently move in the same direction over a specified period.
- Negative Correlation: Two assets consistently move in opposite directions.
- Low / Near-Zero Correlation: Two assets show little to no consistent linear price relationship.
How to Interpret Correlation Coefficients
Correlation is expressed as a coefficient between −1.0 and +1.0:
- +1.0: Perfect positive linear correlation.
- −1.0: Perfect negative linear correlation.
- 0.0: No linear correlation.
Caution: A near-zero correlation coefficient simply means there is no linear relationship—it does not rule out complex, non-linear dependencies.
Why Asset Correlations Change Over Time
Correlations are not static facts; they are evolving historical measurements. Relationships shift rapidly due to changing central bank policy cycles, unexpected liquidity shocks, market volatility, or structural shifts in the global economy.
Correlation Does Not Prove Causation
Two markets may rise in tandem simply because both are responding to an underlying third variable such as loose central bank monetary policy rather than one market driving the other.
Practical Cross-Asset Trading Examples
To see how intermarket analysis operates in practice, consider these three hypothetical market scenarios:
Scenario 1 — Oil Prices Rise After a Supply Disruption
- Initial Event: Geopolitical tensions lead to an unexpected crude oil supply contraction.
- First-Order Effect: Crude oil prices surge.
- Cross-Asset Impact: Higher oil prices raise global inflation expectations. Energy-exporting currencies strengthen, while equity indices of heavily energy-dependent importing nations experience selling pressure due to anticipated margin compression.
Scenario 2 — Interest-Rate Expectations Shift Higher
- Initial Event: A central bank releases higher-than-expected inflation metrics.
- First-Order Effect: Traders price in aggressive upcoming interest rate hikes.
- Cross-Asset Impact: Sovereign bond yields rise, driving the domestic currency upward. Non-yielding assets like gold decline, while growth-heavy stock indices face valuation adjustments.
Scenario 3 — Investor Confidence Weakens (Risk-Off Shift)
- Initial Event: Global economic growth data slows sharply.
- First-Order Effect: Investor sentiment pivots to risk aversion.
- Cross-Asset Impact: Equities and cryptocurrencies decline as traders de-risk. Safe-haven assets like gold and top reserve currencies experience inflows.
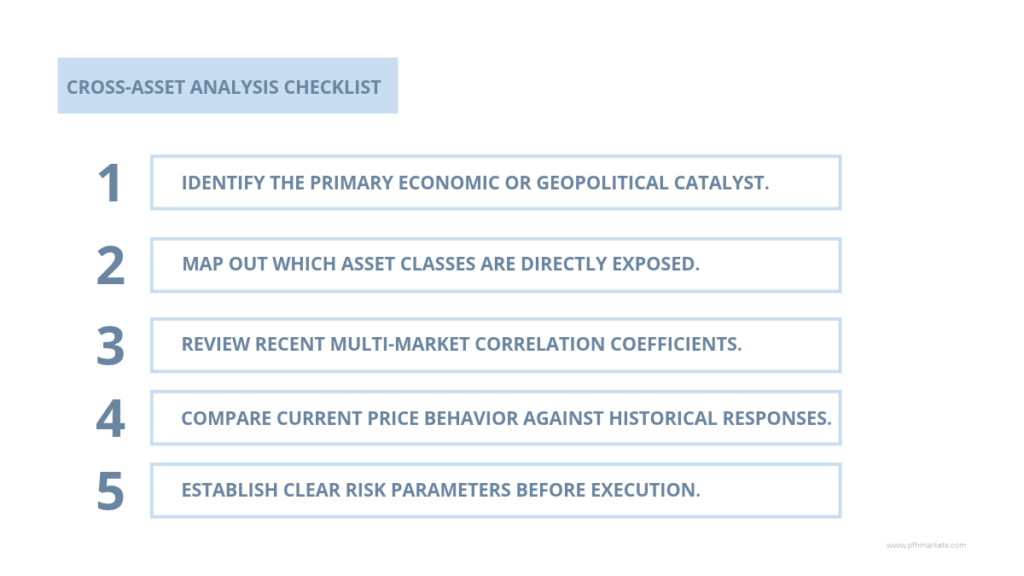
A Simple Cross-Asset Analysis Checklist
How to Use Cross-Asset Trading for Diversification and Risk Management
Understanding market interconnections is vital for portfolio construction and risk control.
Diversification Across Asset Classes
Simply holding multiple instruments does not guarantee a diversified portfolio if all held instruments react identically to the same macroeconomic driver. True diversification requires holding assets with varying risk profiles and low structural correlation.
Identify Hidden Concentration Risk
A trader holding long positions in foreign exchange pairs, growth stocks, and cryptocurrencies might assume they have a diversified portfolio. However, if all three positions depend heavily on a low-interest-rate, risk-on environment, the portfolio harbors hidden concentration risk if macroeconomic sentiment suddenly shifts.
Manage Volatility and Position Size
Cross-asset analysis should complement, not replace, sound risk management. Traders must maintain disciplined stop-loss placement, manage position sizing according to market volatility, and monitor total aggregate exposure.
Avoid Common Cross-Market Analysis Mistakes
- Assuming historical correlations will remain constant forever.
- Treating high correlation as a guaranteed trade signal.
- Overlooking structural differences and specific news events for individual assets.
- Ignoring the compounding impact of trading leverage across correlated markets.
How to Start Exploring Multiple Financial Markets
For those interested in exploring multi-asset analysis, taking a structured, step-by-step approach is essential.
Start With a Small Watchlist
Select a small group of benchmark assets to observe:
- Forex: A major pair (e.g., EUR/USD).
- Commodity: Gold or Crude Oil.
- Crypto: Bitcoin.
- Index: A major equity index (e.g., S&P 500).
Track Relationships Before Acting
Observe how these instruments react to high-impact economic releases (such as central bank rate announcements or inflation data) before committing real capital. Compare price action across daily and weekly timeframes to develop market intuition.
Learn Each Market’s Characteristics
Take time to study each market’s specific characteristics such as exploring forex markets, trading cryptocurrency markets, or tracking global indices before placing trades.
FAQ
How Does Cross-Asset Trading Differ From Cross-Market Trading?
While cross-asset trading emphasizes active trading across different asset categories, cross-market trading specifically focuses on analyzing the relationships, pricing differentials, and interdependencies between distinct markets.
Which Markets Are Most Closely Related?
Market relationships vary over time, but historically, strong relationships exist between commodity-linked currencies and their underlying exports, as well as between gold and real US interest rates.
How Does Asset Correlation Help Traders?
Asset correlation helps traders quantify shared exposure across multiple positions, improve risk management, avoid unintentional concentration risk, and structure more balanced portfolios.
Can Forex Movements Affect Gold and Oil Prices?
Yes. Because major global commodities like gold and crude oil are denominated in US Dollars, significant movements in foreign exchange markets—particularly USD strength or weakness directly influence commodity pricing dynamics.
Do Bitcoin and Stock Indices Always Move Together?
No. While Bitcoin and stock indices frequently show high correlation during broad risk-on or risk-off regimes, crypto-specific factors (such as network upgrades or regulatory changes) often cause them to diverge.
Is Cross-Asset Trading Suitable for Beginners?
Beginners can benefit immensely from analyzing cross-asset relationships to understand global macroeconomics, but should start by tracking a small watchlist before attempting complex multi-asset strategies or using leverage.
Conclusion Why Cross-Asset Relationships Matter
Financial markets operate as part of a global, interconnected economic ecosystem. Forex, commodities, cryptocurrencies, and equity indices are continually linked through central bank policies, global liquidity, inflation trends, and shifting investor sentiment.
By understanding asset correlation and adopting intermarket analysis, traders can develop a holistic view of financial markets, manage portfolio risk more effectively, and make more informed decisions. Ultimately, analyzing what drives each asset class provides far more value than assuming one market will always predict the direction of another.