

It is one of the most confusing paradoxes in modern finance: a government agency releases a disastrous economic report unemployment is ticking up, manufacturing activity is contracting, or consumer spending is slowing down and yet, stock markets immediately surge higher. For beginner and intermediate traders, watching financial markets rally in response to objectively bad news feels completely counterintuitive.
However, financial markets rarely operate on surface-level headlines. Instead, asset prices move based on a complex web of market expectations, future central bank policy, bond yield adjustments, and corporate valuation mechanics.
At its core, bad economic news can be good news for markets when it improves the expected outlook for interest rates more than it damages the outlook for economic growth and corporate profits.
Understanding this mechanism is essential for anyone navigating global financial markets. This article breaks down why markets react to expectations rather than headlines, how weak economic data changes central bank trajectories, how different asset classes respond, and critically when bad economic news turns genuinely bad for investors.
Why Markets Do Not Always React to Economic News as Expected
To understand why markets can rise after weak economic reports, you first have to understand how financial markets process information. Markets are not real-time report cards on the current state of the economy; they are forward-looking discounting mechanisms designed to price in future conditions.
Why Markets Respond to Expectations Rather Than Headlines Alone
When an economic data point is released, institutional investors and traders do not simply ask, “Is this number good or bad?” Instead, they immediately evaluate: “How does this release compare to what was already priced into the market?”
Prices in liquid markets continuously reflect the consensus view of thousands of analysts, fund managers, and algorithms. By the time an economic indicator is officially published, its anticipated value is already largely reflected in asset prices. Therefore, the price movement following a release is driven almost entirely by the element of surprise the delta between the forecast and the actual figure.
Market Reaction = Actual Data − Market Expectations
Actual Results vs. Forecasts and Previous Readings
Every major economic release features three key numbers:
- The Previous Reading: The data from the prior month or quarter.
- The Consensus Forecast (Expectations): The median prediction from leading economists.
- The Actual Release: The official figure published by the government or reporting agency.
A report can show a sharp decline compared to the previous reading indicating economic deterioration while still triggering a bullish market response if the actual figure beats the pessimistic consensus forecast.
Why Disappointing Data Can Still Be Better Than Feared
Consider a simple hypothetical scenario in the labor market:
Scenario Example:
Suppose a central bank has been aggressively raising interest rates to cool an overheating economy. Heading into the monthly non-farm payrolls report, market consensus expects non-farm payroll growth to drop from 250,000 to 100,000. However, rumors and secondary indicators cause traders to fear a severe contraction of negative 50,000 jobs.
When the official report is released, it shows job growth slowed to 40,000.
Technically, the report confirms that job growth slowed dramatically compared to the previous reading and missed the main forecast. However, because the market had braced for a catastrophic negative number, the release is viewed as a relief. Stock futures rally because the result was weak, but better than feared.
How Markets Price in Expectations Before an Announcement
Before an economic release, asset prices shift dynamically as market participants position themselves for potential outcomes. Options markets price in expected volatility, bond yields adjust to consensus forecasts, and currency pairs trade within defined ranges.
To learn more about how asset prices adjust prior to scheduled economic releases, read our guide on why markets move before the news.
How Weak Economic Data Can Increase Rate-Cut Expectations
The primary driver behind the “bad news is good news” dynamic lies within monetary policy specifically, how central banks respond to economic activity.
[Weak Economic Data] ➔ [Expectation of Slower Inflation] ➔ [Increased Rate-Cut Expectations] ➔ [Lower Bond Yields] ➔ [Supported Asset Valuations]
How Slowing Growth Can Change Central Bank Expectations
Central banks such as the U.S. Federal Reserve, the European Central Bank (ECB), and the Bank of England (BoE) typically operate under mandates to maintain price stability and support maximum sustainable employment.
When economic growth is surging and labor markets are overly tight, central banks raise interest rates to prevent inflation from spiraling. Conversely, when economic data turns weak—showing declining retail sales, rising unemployment, or cooling manufacturing activity it signals that aggregate demand is shrinking.
For investors, weaker economic data implies that the central bank no longer needs to keep interest rates high. In fact, it suggests that policymakers may soon need to cut interest rates or inject liquidity to prevent a prolonged slump.
Why Lower Expected Interest Rates May Support Asset Valuations
Interest rates are the bedrock of global financial asset pricing. When market participants begin pricing in future rate cuts, the entire valuation structure of financial assets changes:
- Valuation Models: Institutional investors value equities using Discounted Cash Flow (DCF) models. These models calculate the present value of a company’s future earnings using a discount rate heavily tied to prevailing central bank interest rates. When expected interest rates drop, the discount rate decreases, which mathematically increases the present value of future corporate earnings.
- Capital Allocation: Lower interest rates reduce the yield offered by risk-free assets like cash and short-term government bonds. As yields fall, investors are forced out of cash and into higher-yielding, riskier assets such as stocks, corporate credit, and commodities.
How Monetary Policy Affects Borrowing Costs and Company Valuations
High interest rates increase borrowing costs for businesses and consumers alike. When economic reports suggest that rates have peaked and are likely to fall:
- Corporate debt servicing costs are expected to decline, relieving financial pressure on leveraged firms.
- Consumer credit (mortgages, credit cards, auto loans) becomes cheaper, laying the groundwork for an eventual recovery in consumer spending.
- Growth stocks particularly technology companies that rely on heavy borrowing and long-term earnings projections often lead market rallies because their future cash flows become significantly more valuable in a low-yield environment.
Why a Rate Cut Is Not Guaranteed After Weak Economic Data
It is critical to recognize that weak data does not automatically trigger a central bank rate cut. Central banks look at broad trends rather than a single month’s data point. If inflation remains uncomfortably high, central bankers may be forced to keep interest rates elevated even as the broader economy slows down a dangerous scenario known as stagflation.
For a detailed exploration of how central bank actions ripple across asset classes, check out our analysis on how interest rate decisions affect forex, gold & crypto.
The Role of Inflation, Bond Yields and Central Banks
Understanding the interaction between weak growth, persistent or falling inflation, and government bond yields is essential for determining whether bad economic news will lead to a market rally or a market crash.
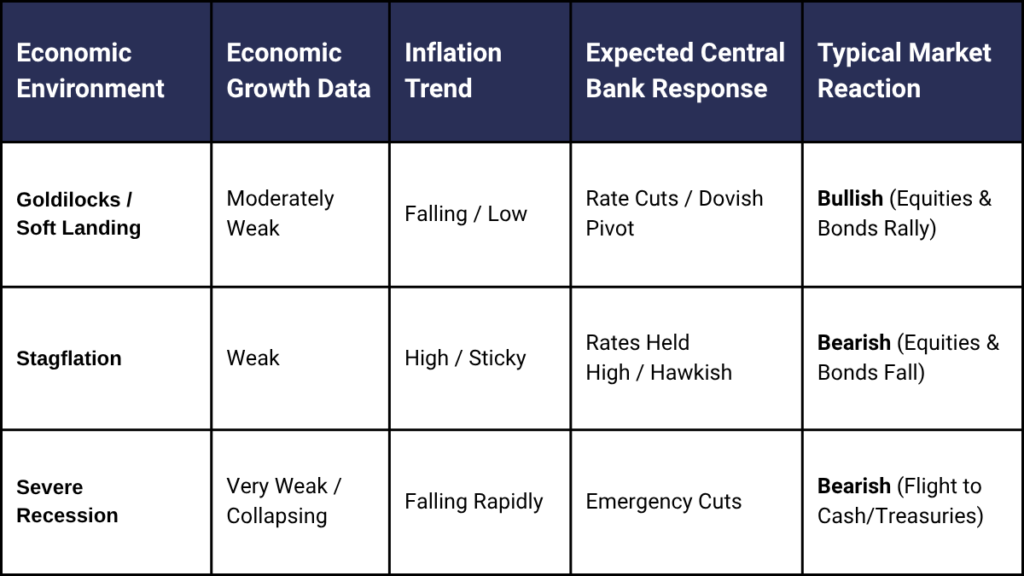
Why Weaker Growth and Falling Inflation Can Support Markets
When economic slowdown is accompanied by easing inflation, markets enter a favorable setup. Falling inflation gives central banks clear permission to cut interest rates without worrying about price pressures reigniting.
In this scenario, bad economic news acts as the catalyst that officially ends a central bank’s rate-hiking cycle, clearing the path for monetary easing and cheaper liquidity.
How Bond Yields Reflect Changing Rate Expectations
Government bond yields such as the US 10-Year Treasury yield serve as a real-time barometer for interest rate expectations:
- Rising Yields: Signal stronger economic growth or higher expected inflation, leading to tighter monetary policy (often negative for equity valuations).
- Falling Yields: Signal weakening economic growth or cooling inflation, leading to expectations of monetary easing (often positive for long-duration growth equities).
When a weak economic report hits the wires, bond yields frequently drop within seconds. Equity markets often key off this drop in yields; if bond yields fall significantly, equity index futures often bounce sharply in response.
Why Weak Growth Combined with Persistent Inflation Can Hurt Markets
The “bad news is good news” dynamic breaks down completely when inflation remains stubborn.
If economic growth indicators (such as GDP or Manufacturing PMI) show economic contraction, but inflation metrics (like CPI or PPI) remain elevated, markets face the threat of stagflation. In a stagflationary environment, weak economic data is purely negative: it signals declining corporate profits, yet central banks are powerless to cut interest rates because doing so would exacerbate inflation.
How Central Bank Guidance Can Confirm or Contradict Market Expectations
Markets move on rate-cut expectations, but those expectations require confirmation from central bank officials. Through public speeches, formal policy statements, and press conferences, central bankers frequently manage market pricing.
If the market rallies on weak economic data expecting a rate cut, but central bank officials issue hawkish commentary stating that policy will remain tight, the initial market rally can reverse rapidly.
Inflation figures are among the most critical inputs for policy expectations. Read our breakdown on the differences between CPI and PPI inflation data
to understand which metrics influence central banks most.
Which Economic Indicators Can Trigger This Market Reaction?
Not all economic reports carry equal weight. Financial markets pay closest attention to high-impact tier-1 indicators that directly influence monetary policy decisions. To track these releases in real time, traders rely on tools to evaluate incoming forecasts against historical trends; learn the fundamentals in our guide on how to read an economic calendar.
Employment and Unemployment Data
- Key Releases: U.S. Non-Farm Payrolls (NFP), Unemployment Rate, Initial Jobless Claims, ADP Employment Change.
- Why Markets Watch It: Central banks monitor the labor market closely. A tight labor market drives wage growth, which can feed into services inflation.
- The “Bad News” Reaction: A surprisingly high unemployment rate or a weak job creation number suggests the labor market is cooling, which reduces inflationary pressures and accelerates expectations for rate cuts.
Consumer Price Index (CPI) and Producer Price Index (PPI)
- Key Releases: Headline CPI, Core CPI (excluding food & energy), PPI, Personal Consumption Expenditures (PCE).
- Why Markets Watch It: CPI measures consumer inflation, while PPI measures wholesale price pressures.
- The “Bad News” Reaction: In an environment where interest rates are high, weaker-than-expected inflation data (or outright disinflation) is viewed very positively by equity markets because it removes the need for high interest rates.
GDP Growth and Business Activity Surveys
- Key Releases: Quarterly Gross Domestic Product (GDP), Purchasing Managers’ Indexes (ISM Manufacturing and Services PMIs).
- Why Markets Watch It: PMIs are leading indicators of business health. A reading above 50 indicates expansion; below 50 indicates contraction.
- The “Bad News” Reaction: A drop in PMI into soft contraction territory (e.g., 47–49) often fuels expectations that monetary policy has become overly restrictive and must be loosened soon.
Retail Sales and Consumer Confidence
- Key Releases: Monthly Retail Sales, University of Michigan Consumer Sentiment, Conference Board Consumer Confidence.
- Why Markets Watch It: Consumer spending drives roughly two-thirds of economic activity in major economies like the United States.
- The “Bad News” Reaction: A moderate drop in retail sales shows that high interest rates are successfully dampening consumer demand, bringing central banks closer to achieving their inflation targets.
Central Bank Statements and Policy Decisions
- Key Releases: FOMC Statement, Rate Decisions, Meeting Minutes, Central Bank Governor Speeches.
- Why Markets Watch It: These releases provide direct, unmediated communication regarding the future path of interest rates.
- The “Bad News” Reaction: When central bank statements acknowledge economic weakness and adopt a “dovish” tone signaling an openness to slowing rate hikes or cutting rates, asset markets often rally strongly.
How Different Financial Markets React to Bad Economic News
A single economic report does not affect all asset classes in the same way. When disappointing data is released, different markets evaluate the news through their own specific lenses.
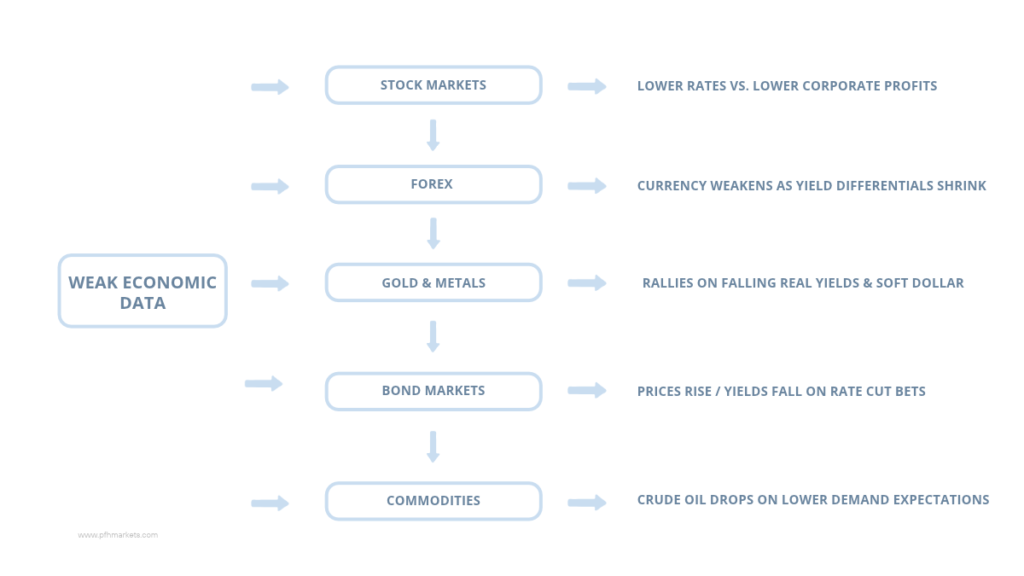
Stock Markets: Lower Expected Rates vs. Weaker Corporate Earnings
Stock indices experience a tug-of-war between valuation multiples and earnings forecasts:
- The Bullish Case (Lower Rates): Lower expected interest rates expand price-to-earnings (P/E) multiples, particularly for high-growth tech stocks.
- The Bearish Case (Lower Growth): Weak economic activity reduces corporate revenue and profit margins.
If investors believe the drop in interest rates will outweigh the temporary decline in corporate earnings, global stock indices will rally. If they believe a severe drop in earnings is coming, stocks will fall.
Forex: Currency Movements Driven by Relative Rate Expectations
In currency markets, currencies are valued largely on interest rate differentials between countries.
- Capital flows toward countries offering higher relative yields.
- If a country releases extremely weak economic data, expectations for its central bank’s interest rates drop relative to other nations.
- As a result, that country’s national currency usually weakens. For example, weak U.S. economic data often depresses the U.S. Dollar Index (DXY) as yields drop relative to European or Asian sovereign bonds.
Gold: Real Yields, the Dollar, and Demand for Perceived Safety
Gold and other precious metals generally benefit when bad economic news hits the market. Because the asset pays no coupon or yield, its opportunity cost decreases whenever government bond yields fall.
Price movements across precious metals following weak economic releases are driven primarily by three factors:
- Falling Real Yields: Real yields represent nominal Treasury yields minus inflation expectations. When real yields drop, holding non-yielding metals becomes far more attractive to institutional investors.
- A Weaker U.S. Dollar: Since precious metals are priced globally in USD, a softening dollar makes bullion significantly cheaper for international buyers.
- Safe-Haven Demand: If economic reports signal systemic risk or deeper financial instability, capital flows naturally into physical assets as a protective buffer.
Bond Markets: Changing Expectations for Future Interest Rates
Government bonds have an inverse relationship with interest rates: when yields fall, bond prices rise.
- Weak economic data signals that interest rates will likely be cut in the future.
- Investors rush to lock in current higher yields by purchasing government bonds.
- This buying pressure drives bond prices higher and pushes benchmark bond yields lower across the yield curve.
Energy Markets: Demand Expectations vs. Supply Risks
Unlike equities or gold, energy markets like crude oil typically view weak economic news negatively.
- Industrial production, shipping, and consumer travel are major drivers of global oil consumption.
- Disappointing economic data such as a slump in global manufacturing PMIs—signals reduced demand for energy.
- Consequently, crude oil and other industrial commodities often sell off after weak economic reports, even if stock markets are rallying.
Four Scenarios That Explain Why Bad News Can Move Markets Higher
To visualize how these principles play out in real trading environments, examine these four distinct market scenarios:
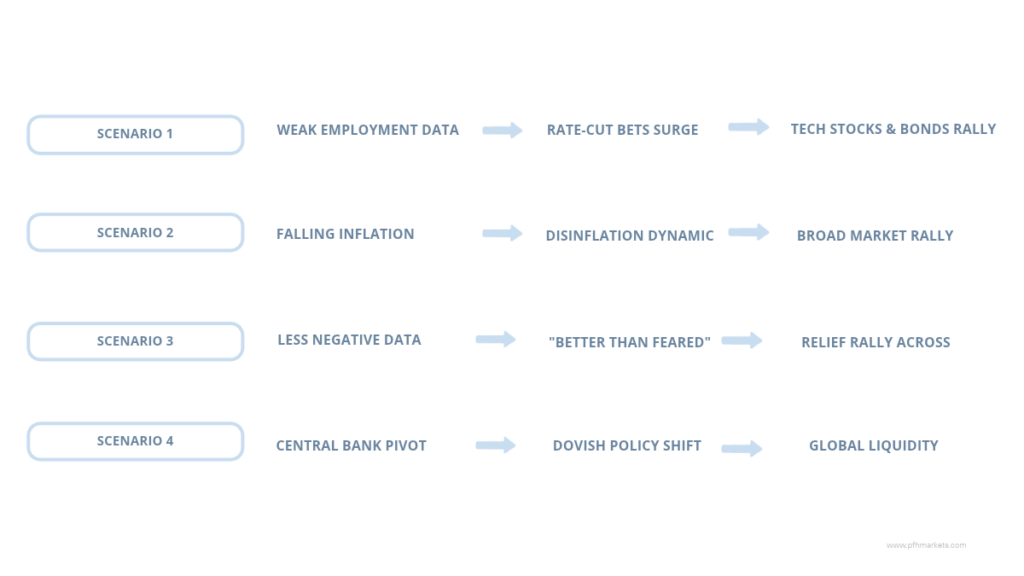
Weak Employment Data Increases Expectations of Monetary Easing
- What the Data Shows: A monthly employment report shows that wage growth has flattened and non-farm payrolls came in well below consensus forecasts.
- How Expectations Change: Traders conclude that a cooling labor market will reduce consumer spending, curbing inflation and forcing the central bank to cut interest rates sooner than previously guided.
- Which Markets Respond: Sovereign bond prices surge (yields drop), growth-focused stock indices (like the Nasdaq 100) rally on lower discount rates, and the domestic currency softens.
- What Could Invalidate the Reaction: If wage growth unexpectedly accelerates within the same report, inflation fears will offset the low payroll number, causing stocks to fall.
Inflation Falls More Than Expected Despite Slowing Growth
- What the Data Shows: Headline and Core CPI data come in below expectations, while retail sales figures show zero growth.
- How Expectations Change: Investors see clear evidence that high interest rates have successfully extinguished inflation without causing an immediate economic collapse (a “soft landing”).
- Which Markets Respond: Stock markets rally broadly, bond yields drop, and high-yield credit spreads narrow.
- What Could Invalidate the Reaction: If business activity surveys released simultaneously show that corporate revenues are dropping far faster than input costs, profit margin compression will trigger equity selling.
Economic Data Is Weak but Less Negative Than Investors Feared
- What the Data Shows: GDP contraction for the quarter comes in at -0.2%, following widespread market rumors and preliminary estimates suggesting a -1.0% slump.
- How Expectations Change: The severe recession that was priced into markets over previous weeks fails to materialize. The result represents a positive surprise relative to panicked sentiment.
- Which Markets Respond: Cyclical equities, industrial sectors, and risk-sensitive currencies experience a sharp “relief rally.”
- What Could Invalidate the Reaction: If follow-up revisions to previous quarters confirm that economic momentum is deteriorating rapidly, the relief rally will prove short-lived.
A Central Bank Signals a Less Restrictive Policy Outlook
- What the Data Shows: A mix of soft manufacturing and consumer data prompts the central bank chairperson to state in a press conference that “policy is now in restrictive territory and risks are becoming balanced.”
- How Expectations Change: Markets interpret the statement as an official dovish pivot confirming that the central bank is done raising rates and is preparing for monetary easing.
- Which Markets Respond: Gold, global equities, and sovereign bonds rally simultaneously, while short-term money market rates fall.
- What Could Invalidate the Reaction: If upcoming inflation releases suddenly spike higher, the central bank will be forced to walk back its dovish guidance, triggering a severe market correction.
When Bad Economic News Causes Markets to Fall Instead
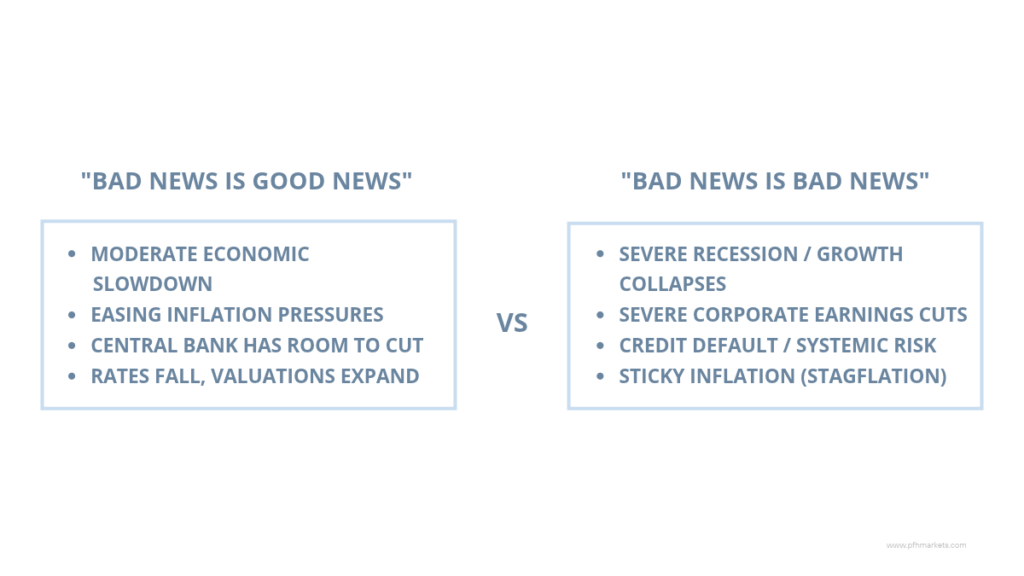
The “bad news is good news” dynamic is not an unbreakable rule of finance. There is a precise tipping point where weak economic data ceases to be supportive and becomes explicitly bearish.
Understanding where this limit lies is what separates experienced market analysts from novices.
1. When Weak Data Signals a Deeper Recession
Monetary policy cuts cannot instantly repair a damaged economy; rate cuts take anywhere from 6 to 18 months to fully filter through the real economy. If economic data (such as mass layoffs or widespread corporate defaults) reveals that the economy is sliding into a deep recession, lower interest rates will not save asset prices in the short term. Investors shift their focus entirely from rate-cut optimism to economic survival.
2. When Corporate Earnings Expectations Deteriorate Sharply
Stock prices are ultimate reflections of long-term corporate earnings. While a lower interest rate expands a stock’s valuation multiple, a severe drop in revenue directly cuts the earnings baseline (Price = Multiple × Earnings).
If bad economic news implies that corporate profit margins will collapse by 20–30%, the benefit of a slightly lower interest rate is completely overwhelmed by the drop in expected earnings.
3. When Credit Stress or Financial Instability Increases
When economic contraction hits highly leveraged sectors of the financial system, credit markets begin to freeze up. Credit spreads (the interest rate gap between corporate debt and risk-free government bonds) widen dramatically as default risks rise. In times of severe credit stress, liquid assets across the board are sold off in favor of pure liquidity cash and short-term Treasuries.
4. When Inflation Prevents Central Banks From Easing Policy
As noted in our discussion of stagflation, if economic growth collapses while inflation remains well above central bank targets, central bankers are stuck in a policy trap. They cannot cut interest rates without risking hyperinflation or secondary inflation waves. When traders realize the central bank cannot come to the rescue with rate cuts, bad economic news triggers immediate, sharp sell-offs.
5. When Markets Have Already Fully Priced In Rate Cuts
Financial markets are notorious for “buying the rumor and selling the fact.” If equity markets have already staged a massive 20% rally over several months in anticipation of monetary easing, an actual weak economic release might deliver no new bullish catalyst. Once rate-cut expectations hit 100% probability, bad news no longer adds incremental buying power to the market it simply highlights underlying economic weakness.
How Traders Can Interpret the Market Reaction to Economic Data
Rather than placing high-risk trades ahead of economic releases or blindly following initial market spikes, systematic traders utilize a step-by-step framework to process economic data releases.
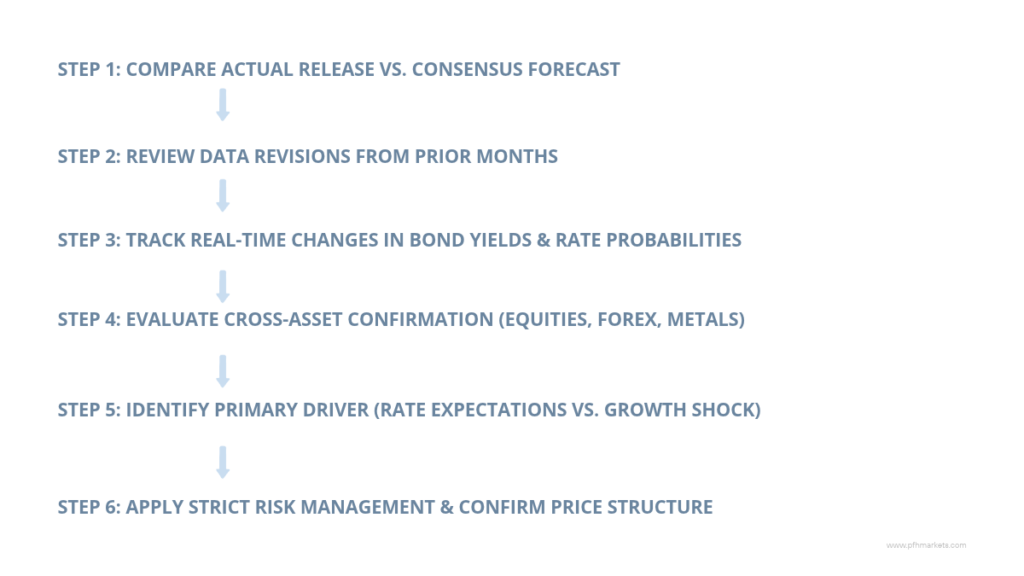
Step 1 — Check the Actual Figure Against the Forecast
Ignore news headlines that simply state a number went “up” or “down.” Immediately locate the consensus forecast figure. Determine whether the release represents a positive surprise, a negative surprise, or an in-line result relative to expectations.
Step 2 — Review Revisions to Earlier Data
Economic reporting agencies regularly revise prior months’ figures when new information arrives. A surprisingly strong current reading can be completely invalidated if the agency simultaneously downgraded the previous two months’ data by a massive margin. Always look at the net adjustment across readings.
Step 3 — Assess Changes in Rate Expectations and Bond Yields
Watch benchmark government bond yields (such as the 2-year and 10-year Treasury yields) immediately following the release. Check central bank interest rate monitoring tools (like the CME FedWatch Tool) to see if the probability of an upcoming rate cut shifted higher or lower following the data.
Step 4 — Compare Reactions Across Relevant Asset Classes
Look for cross-asset confirmation before drawing conclusions:
- Are stocks rising while bond yields drop and gold gains? This confirms a classic monetary-easing reaction.
- Are stocks falling alongside commodities while the U.S. Dollar surges on safe-haven flows? This suggests panic over growth shock or recession.
Step 5 — Determine Whether the Move Reflects Growth, Inflation, or Risk Sentiment
Ask yourself what fundamental factor is dominating price action. Is the market trading on rate-cut optimism (dovish liquidity), recession fears (earnings damage), or disinflation relief? Identifying the prevailing theme prevents you from taking trades aligned with an outdated market regime.
Step 6 — Define Risk Limits and Avoid Reacting to the Headline Alone
The initial 1-minute to 15-minute price action following a tier-1 economic release is dominated by high-frequency algorithmic trading programs clearing out order book liquidity. These initial spikes are frequently reversed once human institutional managers evaluate the full report.
Trading Rule: Wait for the initial knee-jerk volatility to subside, allow the market structure to settle, and base decisions on confirmed price levels and proper risk-to-reward parameters rather than chasing headline spikes.
FAQ
What does “bad news is good news” mean in trading?
"Bad news is good news" refers to market environments where weak economic reports (such as slowing employment or retail sales) are interpreted positively by asset markets. It occurs when investors care more about securing lower central bank interest rates and increased monetary liquidity than about minor slowdowns in economic growth.
Can weak economic data cause interest rates to fall?
Yes. Weak economic data reduces inflation pressures and signals slowing economic activity. In response, bond markets price in future monetary easing, driving government bond yields down. Central banks subsequently cut official benchmark interest rates to stimulate borrowing and investment.
Why can stocks rise when economic growth slows?
Stocks can rise during economic slowdowns because stock market prices reflect future expectations rather than current conditions. If slowing growth prompts central banks to cut rates and inject liquidity, higher equity valuation multiples can offset mild declines in immediate corporate profits.
Why do markets sometimes fall after positive economic data?
When economic growth is strong or inflation is high, positive economic data signals to central banks that the economy is overheating. Investors fear this will force central banks to raise interest rates higher or keep them elevated longer, which increases borrowing costs and depresses stock market valuations.
How do bond yields influence the market reaction to economic news?
Bond yields reflect the market’s real-time expectations for future interest rates and inflation. When weak data causes bond yields to fall, the discount rate applied to corporate earnings drops, often triggering buying in equities, growth stocks, and non-yielding assets like gold.
How can traders compare economic data with market expectations?
Traders use economic calendars that list the consensus forecast from professional economists alongside prior figures. By comparing the published actual number to the consensus forecast, traders can identify whether the news was a positive or negative surprise relative to what markets had already priced in.
Key Takeaways
- Expectations Matter More Than Headlines: Financial markets trade on the difference between published economic data and pre-release expectations, not on absolute numbers alone.
- The Policy Transmission Mechanism: Weak economic data lowers inflation expectations, which increases rate-cut bets, depresses bond yields, and expands equity valuation multiples.
- Asset Class Nuance: A single economic release produces contrasting effects across assets: weak data often supports gold and bonds, depresses national currencies and oil, and impacts stocks depending on broader growth sentiment.
- The Tipping Point: The “bad news is good news” regime holds only when economic weakness is moderate and inflation is falling. If weak data signals a deep recession, severe earnings destruction, or stagflation, bad news becomes genuinely bad for asset prices.
- Focus on Process Over Panic: Successful traders avoid chasing initial headline volatility, choosing instead to analyze bond yield movements, cross-asset confirmation, and consensus surprises before making trading decisions.